See SolarDNA in three minutes
A guided tour: the explore map, a market page, a zip code, the territory builder, installer league tables and the deal estimator. No account needed to look around.
Explore the map
Every state and zip code is scored 0–100 and graded against the others. Click a state to drop to its zip codes; filter by score, growth, $/W, adoption or permits.
Try it live →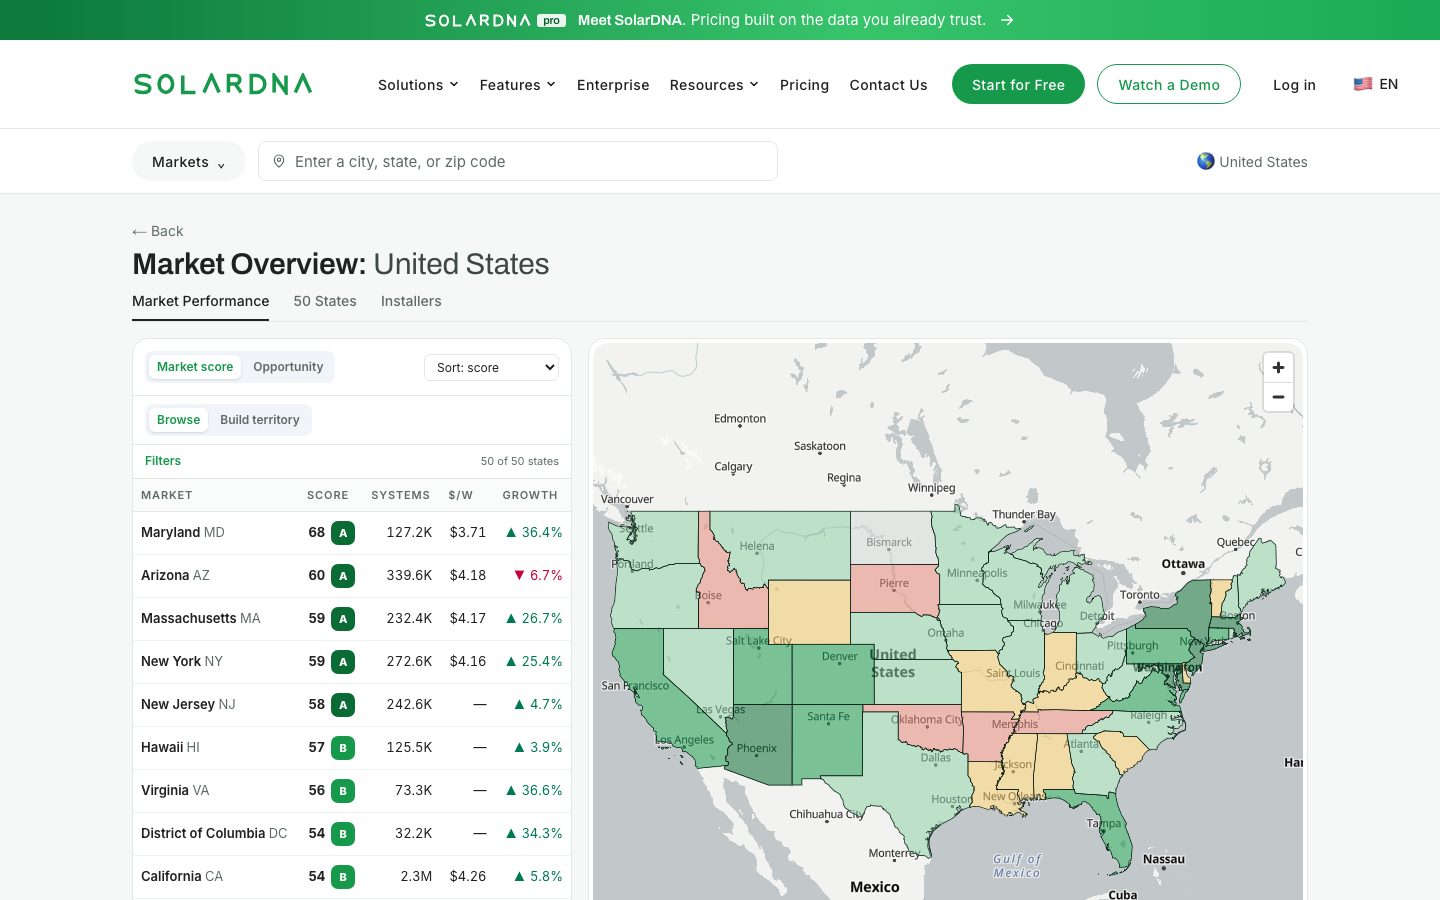
Open a market
Each state page leads with current market totals: systems, capacity, what was added each month, battery share and solar customers by utility. Pricing, installers and the five subscores sit underneath.
Try it live →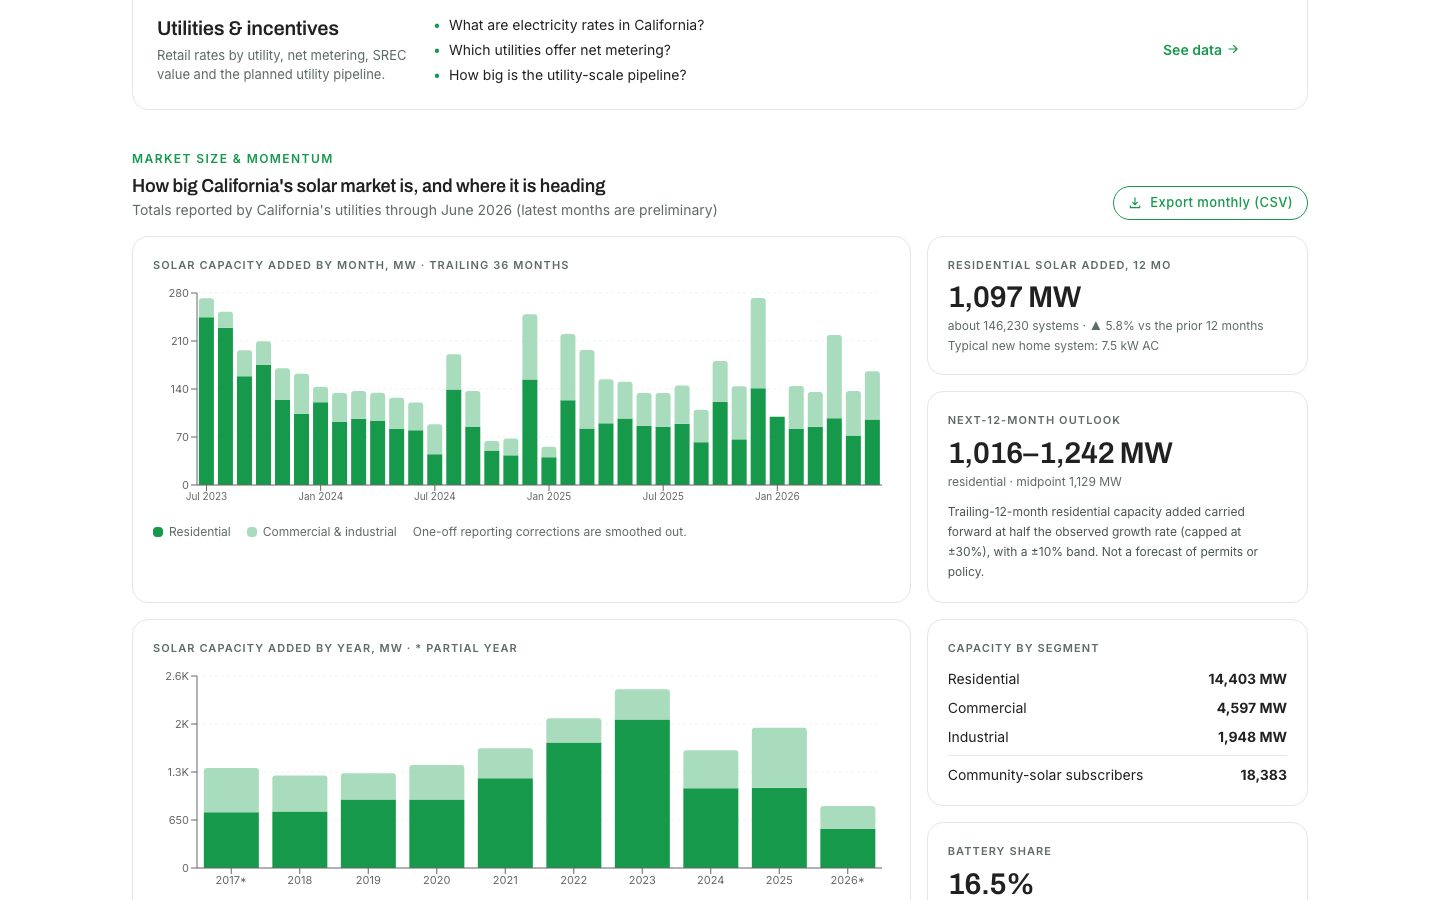
Drill into a zip code
Every zip has its own page: score, installed cost against the state, yearly trend, the installers active there and the nearest zip markets.
Try it live →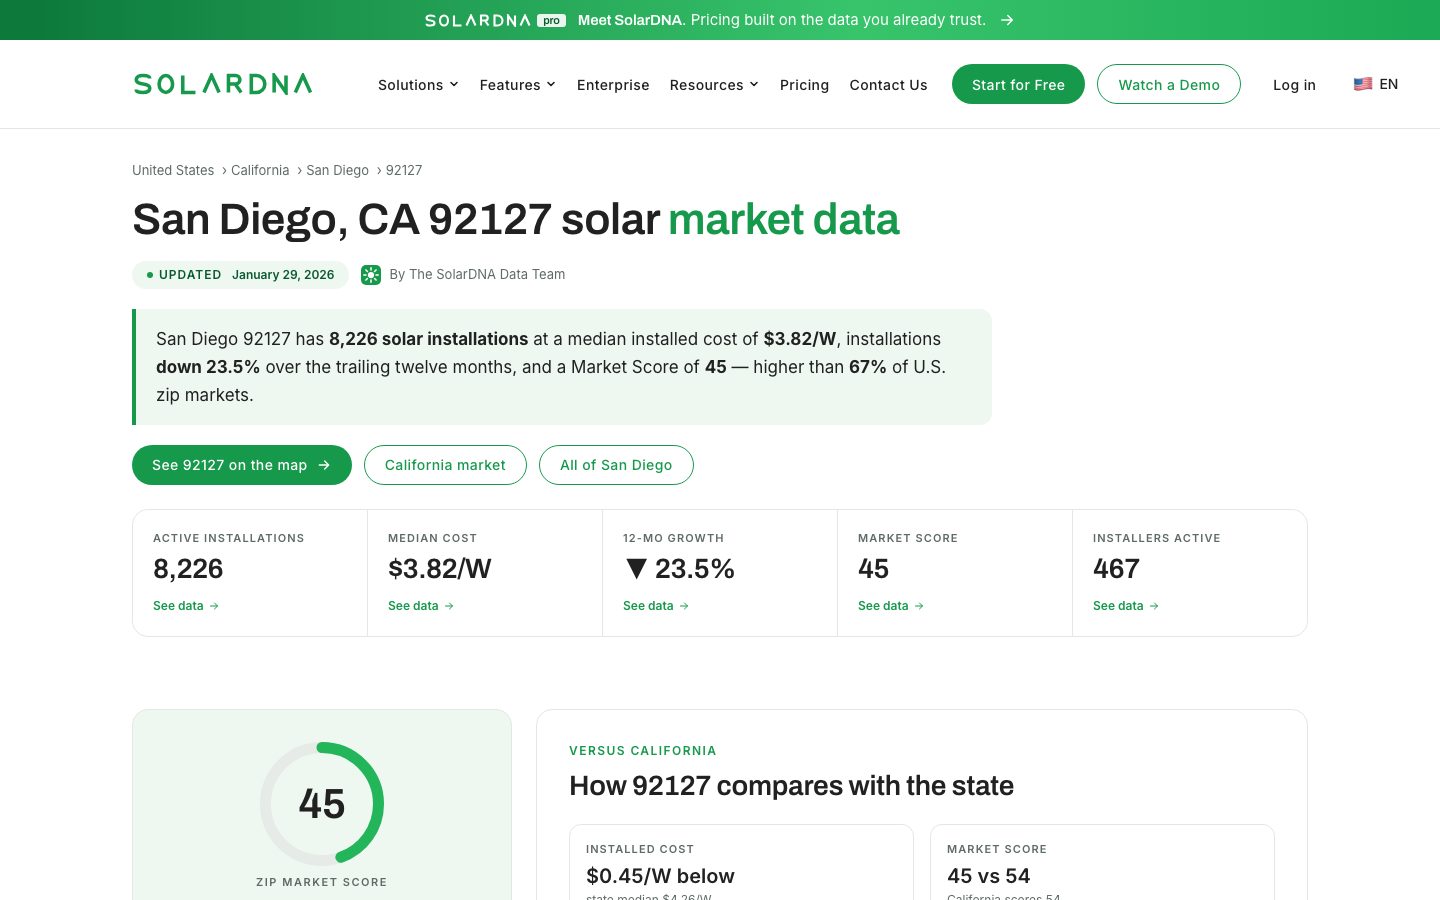
Build a territory
Pick zip codes on the map, one at a time or by radius, and see them as one market. Name it, save it, share the link.
Try it live →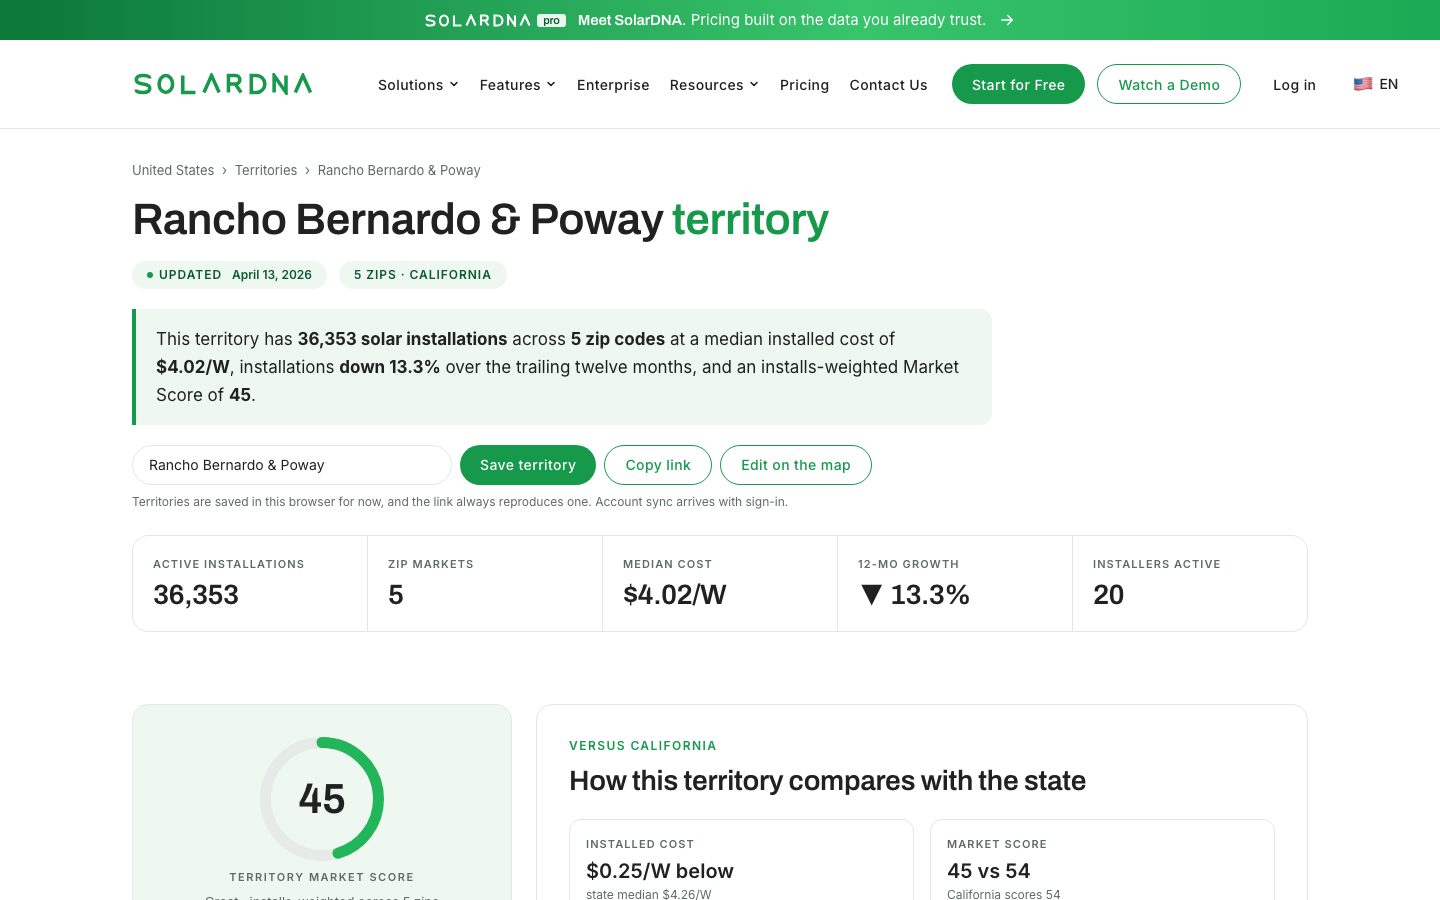
Benchmark the installers
League tables show who wins in each state, how many systems they installed in the last twelve months, what size they sell and what they charge.
Try it live →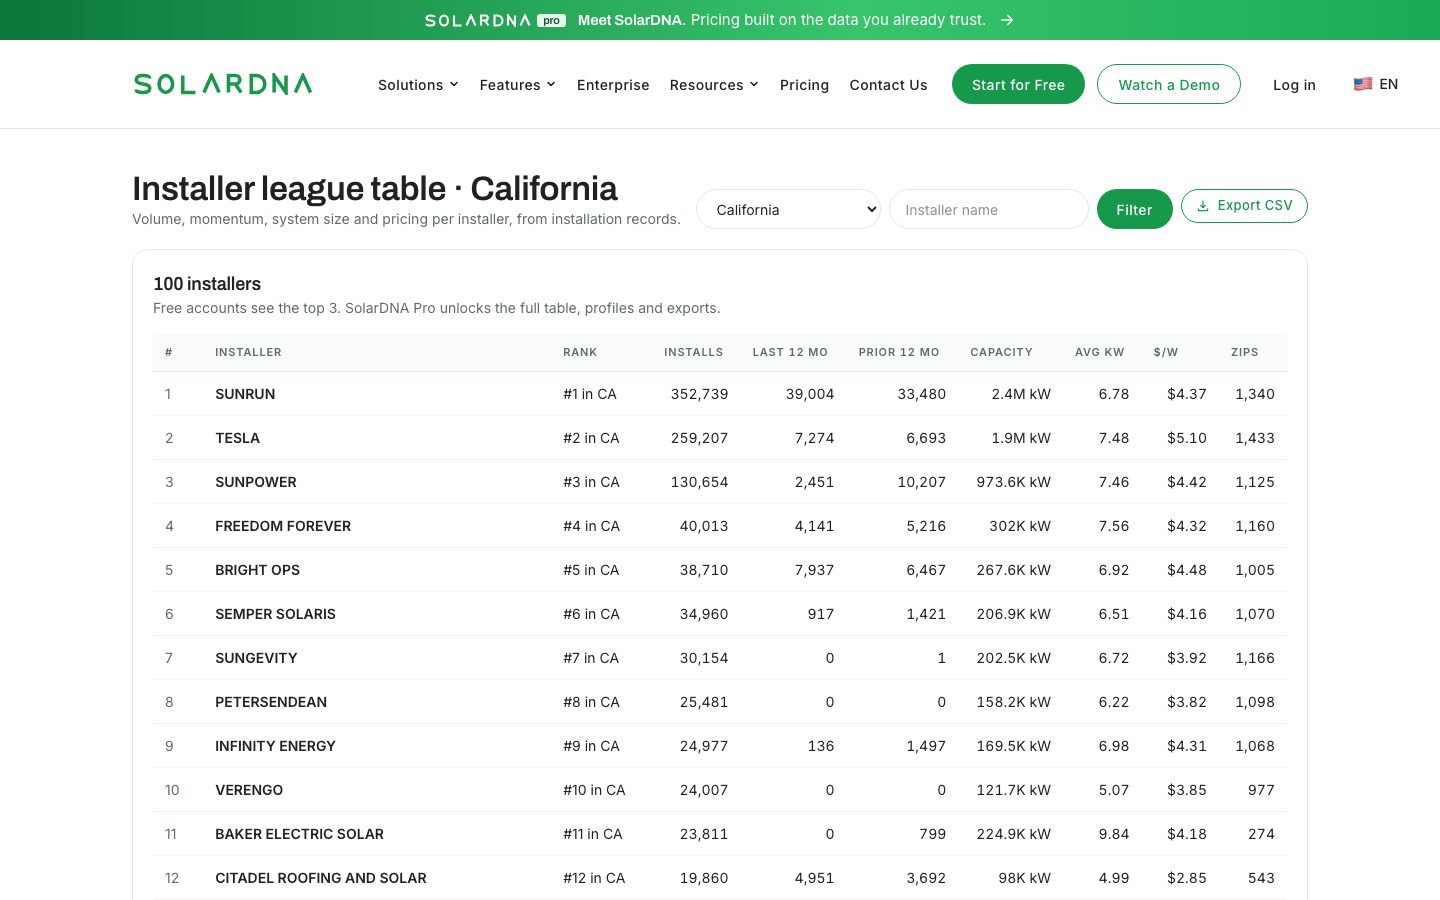
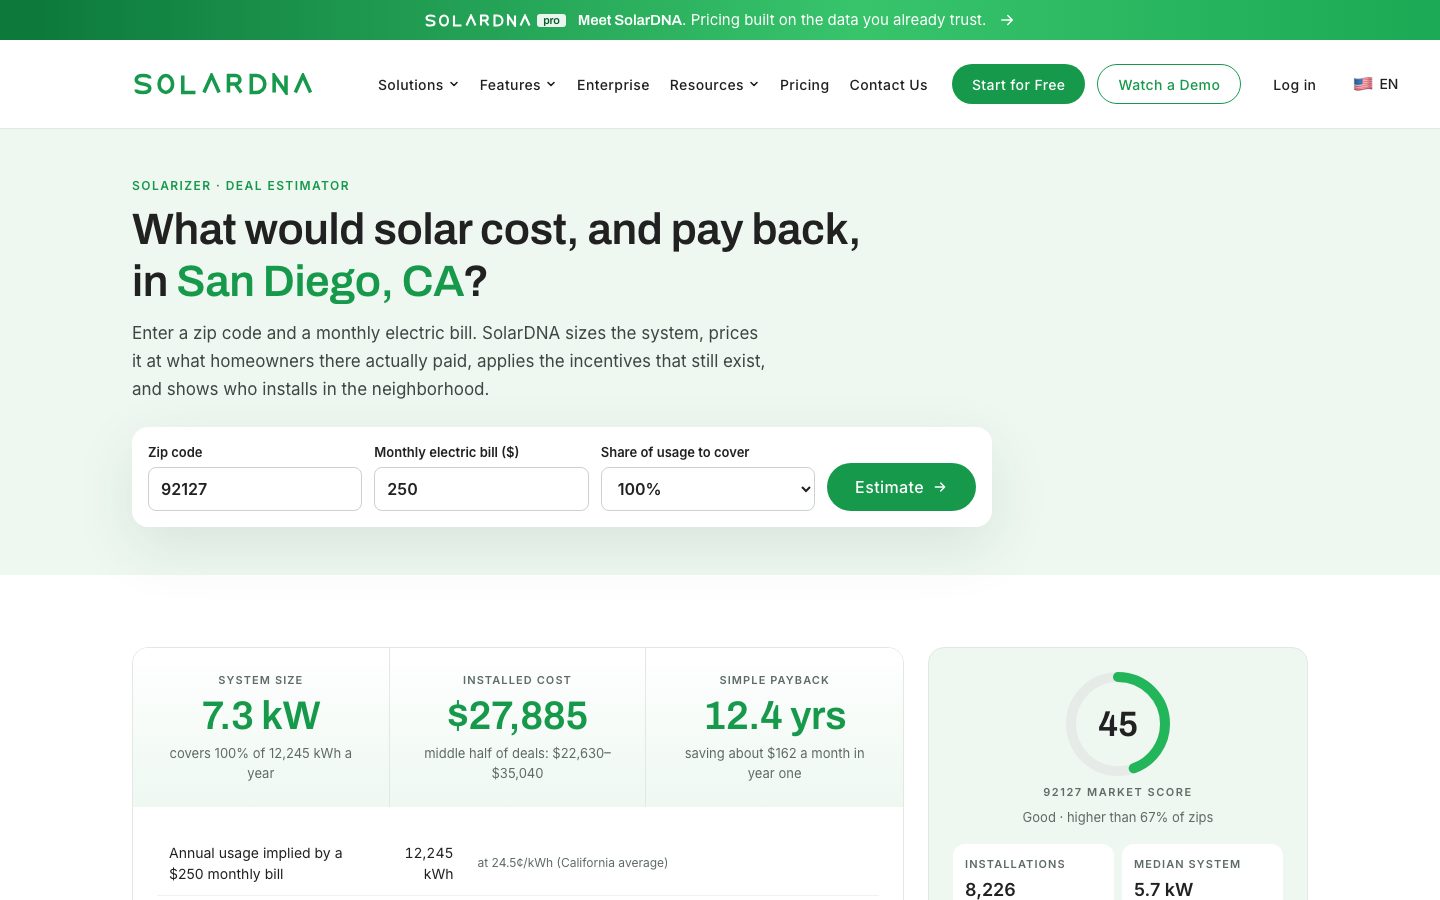
Estimate a deal
A zip code and a monthly bill give a system size, a cost from real local prices, the incentives that still exist, payback, and who installs nearby. Every assumption is printed; it is not a quote.
Try it live →